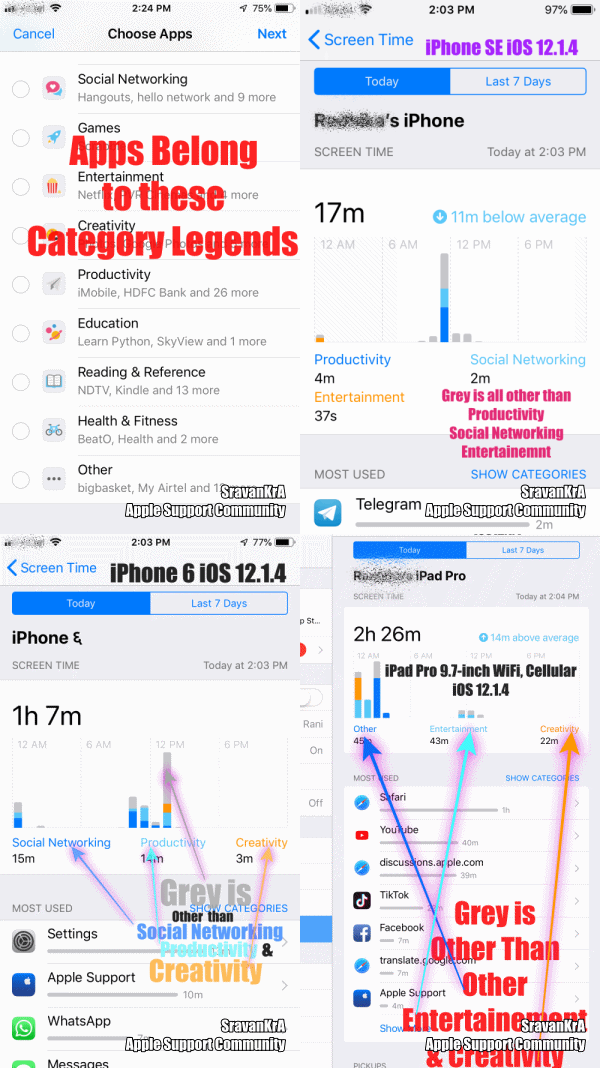
Refer to the list of Categories listed below and pic 1 where Category Serial No. 1 (Social), 7 (Reading), and 12 (Others) are shown Blue, Aqua, and Orange
In this case (Pic 1), all other categories serial nos. 2,3,4,5,6,8,9,10 and 11 are Grey
Pic 1
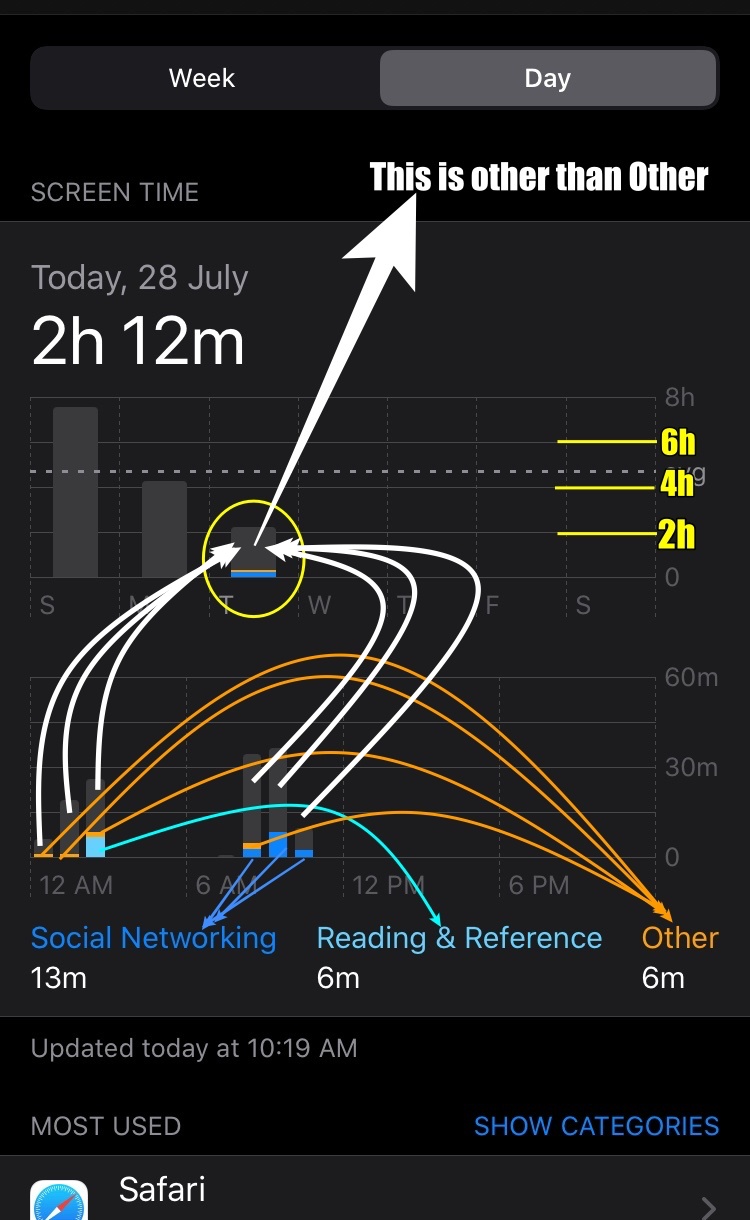

Look at the pic 2 below a cut-out view of a screen from an earlier old post
Pic 2
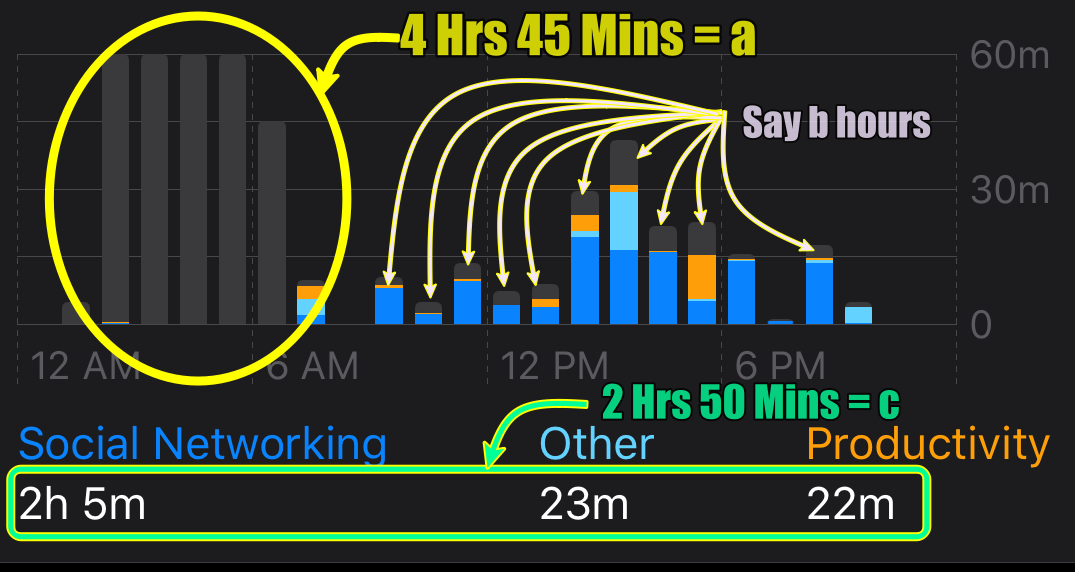
Total Screen Time is a+b+c
*** There are 12 board level Categories in Screen Time
- Social Networking: FaceBook, Hangout, Instagram
- Games: Scrabble, PUBG, Sudoku
- Entertainment: TV, Music, YouTube, Netflix
- Creativity: Photos, Camera, Google Photos
- Productivity: Shortcuts, Mailk
- Education: SkyView, Learn Python
- Information & Reading: Wikipedia, Magzter, Weather, Kindle, NDTV
- Health & Fitness: Journal, Tata 1mg, HeartRate Pro, Activity
- Utilities: App Store, Measure, Truecaller, Calculator
- Shopping and Food: Amazon, BigBasket, Shell Asia
- Travel: Apple Maps, Google Maps, FlightAware, Booking.com, Uber
- Others: Pinterest, iTunes Store, Kia Connect
The graph displays the top 3 (Time used by the user) category legends on the X-axis. Anything other than these legend categories is a Grey bar in the graph
Pic 3
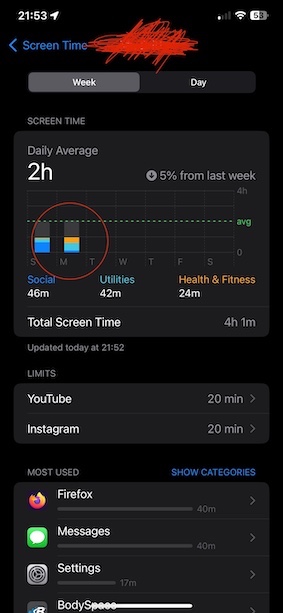
For example:
If the user has used Games, Entertainment & Others category apps for the maximum time during a period then the graph will show these three categories in the X axis as legends and the remaining categories will be shown in Grey Colour.
The GIF below will illustrate the graph from 3 iOS devices
iPhone 6 iOS 12.4.5
iPhone SE iOS 13.3.1
iPad Pro 9.7" Wifi+Cellular iOS 13.3.1
GIF 1